A teen and his stepdad were killed after five members of the same family were struck by an alleged impaired driver at a Las Vegas bus stop.


A teen and his stepdad were killed after five members of the same family were struck by an alleged impaired driver at a Las Vegas bus stop.
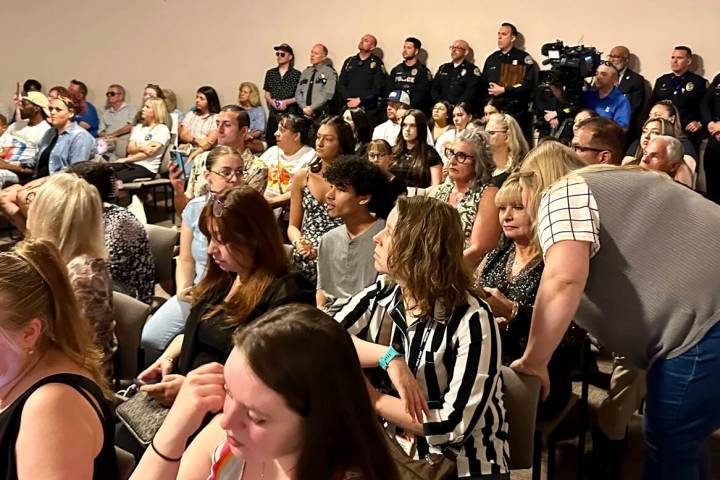
Stop DUI’s annual Heroes and Handcuffs ceremony recognized eight officers who made a combined 588 DUI arrests. The families of fallen troopers Michael Abbate and Alberto Felix were also there.

Golden Knights goaltender Logan Thompson was stellar in net in a victory over the Dallas Stars in Game 2 of the first-round playoff series Wednesday.

Complaint estimates more than 1,000 Vegas restaurants may have been affected.

Two Henderson parents have been arrested on suspicion on child abuse after police found an 11-year-old inside a large metal enclosure inside a residence.

March gaming win was strong — but not as strong as a year ago when casinos had all-time-record slot machine revenue due to stellar lineup of special events.

Tropicana owner Bally’s Corp. filed for a commercial demolition permit with Clark County as preparations continue to build a ballpark for the Oakland Athletics.

At 84, Smokey Robinson is still fit and a master of his performances.

The city of Las Vegas has announced that it will again allow drivers to pay for some parking tickets with the donation of school supplies.

The Thursday high should be near 81, with afternoon winds of 9-15 mph gusting to 22 mph.

The city’s mobsters roots run deep. Here are a list of mob-connected homes that has sold in recent years, including one formerly owned by Frank “Lefty” Rosenthal.

Goaltender Logan Thompson shined in net as the Golden Knights defeated the Dallas Stars on Wednesday to take a 2-0 lead in their first-round playoff series.

Tabatha Tozzi died on April 24, 2023. Police say Tozzi’s then-boyfriend, Oswaldo Natanahel Perez-Sanchez, shot her in the head. He hasn’t yet been caught.

Bishop Gorman announced Wednesday that its baseball team was forfeiting games over paperwork related to the eligibility of a transfer student.

A new poll looks at whether voters would support a potential law that made all workplaces in Nevada, including casinos, completely smoke free while indoors. Unions also weigh in.

Home Means Nevada—those are three words that every Nevadan knows. Aside from being the title of our state anthem, these words are plastered on bumper stickers, t-shirts and souvenirs across the Silver State. Nevada is renowned for its stunning natural landscapes and bustling entertainment scene and it continues to attract new residents drawn by its […]


Locals can watch movies every Monday evening starting in May on the Strip hotel’s 65-foot digital marquee.

The win was one of several recently across the Las Vegas Valley.

Multiple government bodies are attacking the problem of forever chemicals head on, especially with new regulations handed down from the Environmental Protection Agency.

The Raiders and NV Energy joined forces to provide eventgoers at Allegiant Staidum with the ability to charge electric vehicles.