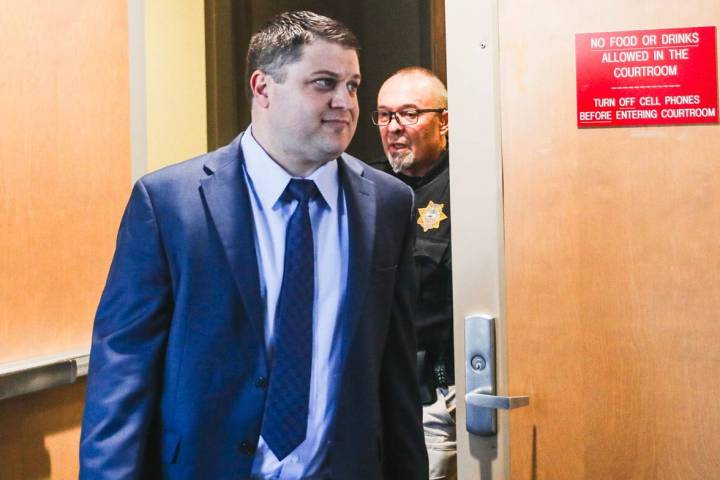
A judge unsealed hundreds of documents and an assemblage of videos from a contentious custody battle linked to a shooting that left three dead.


A judge unsealed hundreds of documents and an assemblage of videos from a contentious custody battle linked to a shooting that left three dead.
When Lisa Rasmussen pulled into the parking lot of Prince Law Group, she knew the deposition would be intense. She had no idea it would turn deadly.
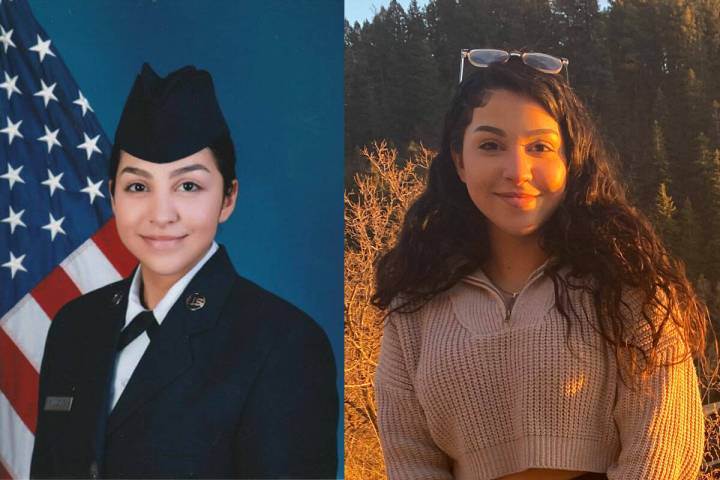
Natalie Villegas, who served in the U.S. Air Force at Creech Air Force Base, was killed by a suspected impaired driver on Saturday. Her father hopes to honor her life and find justice.

One slots player at Caesars Palace used between $1,250 and $2,500 as a starting point for future fortunes.

Transportation Secretary Pete Buttigieg is expected to attend the ceremony for the Las Vegas-to-Southern California high-speed train system.
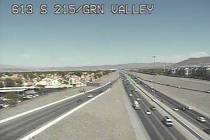
In a six-hour period, a joint law enforcement effort caught 77 red light runners at Green Valley Parkway and the 215 Beltway.
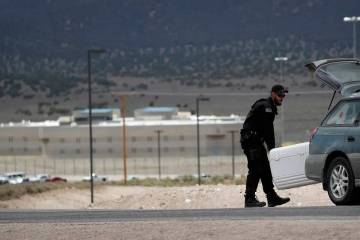
A Nevada prisoner is accused of addressing letters to a federal judge in Las Vegas, threatening to send someone to kidnap and torture the judicial officer and “have my people kill whatever you hold dearly first,” according to a criminal complaint.

Finn the Bat Dog retired from his duties with the Aviators and was honored by the Triple-A team at Las Vegas Ballpark.

The Golden Knights swept the season series 3-0 against coach Pete DeBoer and the top-seeded Dallas Stars, but a lot has changed since then for both teams.

Reggae in the Desert, “The Music of John Williams” and NFL draft festivities lead the entertainment lineup for the week of April 19-25.
The Raiders made a big splash in free agency to fill a hole at defensive tackle, but they are still in need of some pieces and could address it in the draft.

A DUI suspect accused of killing two pedestrians at an east Las Vegas bus stop emitted a “strong odor” of alcohol and told officers that she thought she had suffered a seizure and didn’t remember the crash, according to her Metropolitan Police Department arrest report.
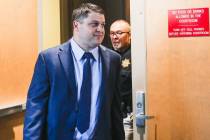
Katherine Houston wrote a concerned letter to her son Dylan around the time of his divorce from Ashley Prince, records show.

The reboot of the series that put Las Vegas on the television map won’t live to see a Season 4.

The North Las Vegas grocery distribution center, which isn’t fully open yet, is holding another hiring event.

Eye care is more important than ever in today’s digital world. With most professions requiring much screen time, your eyes get tired quickly. However, you still need to protect your eyes when entering the world. We always think about sun damage to our skin, but UV rays can also cause cataracts and other eye problems. […]


The Asian-inflected wood-fire barbecue restaurant on the Las Vegas Strip has siblings in Manhattan, Miami and Mexico City.

The Golden Knights lost to the Anaheim Ducks in the regular-season finale Thursday at T-Mobile Arena and fell to the second wild-card berth in the Western Conference.

Plans include a complete renovation of the casino-resort and further development of 35 unused acres behind it.

Former NFL star Tom Brady, a minority owner of the Las Vegas Aces, wrote the entry in Time magazine explaining A’ja Wilson’s inclusion on the most influential list.