The Golden Knights scored three first-period goals to defeat the Dallas Stars in Game 1 of their first-round playoff series Monday.


The Golden Knights scored three first-period goals to defeat the Dallas Stars in Game 1 of their first-round playoff series Monday.

Captain Mark Stone was back in the lineup for the Golden Knights on Monday and scored a power-play goal in a Game 1 win over the Dallas Stars.

A new connection between Laughlin and Bullhead City, Arizona — decades in the making — is nearing completion.

One of the bars lies in a sleek Strip hotel, the other off Strip in a longtime locals favorite.

Brightline West and federal, state and local officials broke ground on the long-discussed high-speed rail system linking Las Vegas and Southern California.

The Raiders have the 13th pick in the NFL draft, but general manager Tom Telesco said Monday he has contingency plans for the first round based on scenarios.

Las Vegas police said the fatal crash happened earlier in April when the bicyclist crossed into the path of a Honda Pilot.

The company said Monday that a majority of Culinary Local 226 employees at the Henderson property signed an employee-led petition to decertify the labor union.

A performer is suing Cirque du Soleil after he was paralyzed by a moving platform in June 2023 during a new act during the “O” show on the Strip.

The news comes as the country music star prepares to debut a six-story bar, restaurant and music venue in downtown Nashville this year.

Las Vegas police were kept busy on Saturday with drivers suspected of impairment.

After missing the postseason in 2022 because of a rash of injuries, the Knights have qualified for the playoffs this season despite facing a similar issue.

The school tallied 35,229 words for middle schools, those with enrollments of 500 to 1,000 students. The total ranked them seventh among all schools in the country.

Clark County District Judge Mark Denton will hear arguments on Wynn Las Vegas’ allegations that rival Fontainebleau is poaching the resort’s executives.

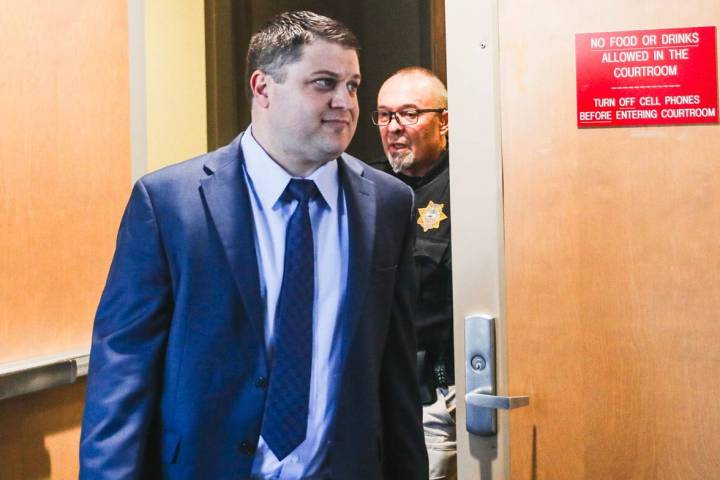
Jemarcus Williams intends to enter a guilty plea during a court hearing on Thursday, according to his public defender.

Generosity: Any act of kindness or support given without expectation of exchange or return from the recipient(s). The game’s biggest stars remain active one month into the NFL offseason. They may not be running drills on the field, but they practice something more important: generosity. Hall of Fame quarterback Troy Aikman and 2022 NFL Man […]


A judge unsealed hundreds of documents and an assemblage of videos from a contentious custody battle linked to a shooting that left three dead.

Phish’s wild audio-visual production creats such a heightened sensation you don’t need assistance.

The balmy ease of the French Riviera inspires this French-Mediterranean spot.

The Plaza Hotel & Casino says it will once again host downtown Las Vegas’ “largest Cinco de Mayo party” next month.