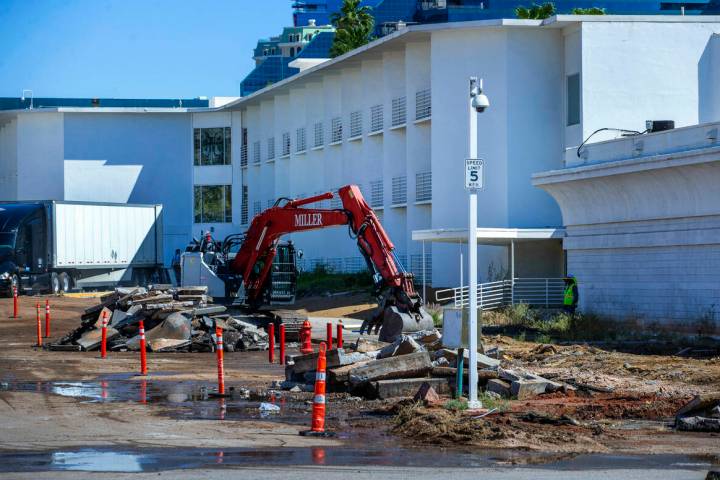
Executives with Tropicana landlord Gaming & Leisure Properties Inc. said the Las Vegas Strip resort closed April 2 as part of the A’s ballpark construction timeline.


Executives with Tropicana landlord Gaming & Leisure Properties Inc. said the Las Vegas Strip resort closed April 2 as part of the A’s ballpark construction timeline.

The Raiders addressed their needs on the offensive line Friday, drafting Oregon’s Jackson Powers-Johnson in the second round and Maryland’s Delmar Glaze in the third.

A CCSD educator arrested in connection with a student-teacher fight was ordered released without bail after a court appearance.

Tesla’s Gigafactory Nevada, a lithium-ion battery and electric vehicle component factory, has about 12,000 employees.

The collision occurred about 6:30 p.m. near South Jones Boulevard and Badura Avenue, according to Metropolitan Police Department Lt. Aaron Lee.
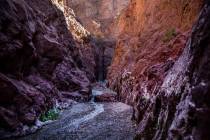
The National Park Service has increased its monitoring of the hot springs area along the Colorado River to ensure that it remains safe for swimming.

The heaviest storm activity during the afternoon was in the mountains on the southern edge of Henderson.

The Raiders introduced tight end Brock Bowers, their first-round pick in the NFL draft, and he discussed growing up in the shadow of the organization’s training camp.

Law enforcement officials are urging caution when using any type of bank or ATM card in public because of the rise of skimming devices that can steal financial information.

A Former Nevada congressional candidate was indicted on a murder charge in connection to the death of an Idaho man in a Strip resort room in the fall.

The Golden Knights crank up the siren before the first, second and third periods. The folks who crank the siren might seem randomly selected, but there is a strategy.

The Las Vegas family attraction, which is aimed at kids ages 5 to 12, features 15,000 square feet of interactive dinosaur exhibits.

President Joe Biden will welcome the Las Vegas Aces to the White House on May 9 to celebrate their championship season, according to the White House.

The Raiders drafted what could be a generational tight end in Georgia’s Brock Bowers, but they had other needs they should have addressed in the first round.

Generosity: Any act of kindness or support given without expectation of exchange or return from the recipient(s). The game’s biggest stars remain active one month into the NFL offseason. They may not be running drills on the field, but they practice something more important: generosity. Hall of Fame quarterback Troy Aikman and 2022 NFL Man […]


The wait is over. Here is who the Raiders picked in the first round of the 2024 NFL draft, and it came as a shock to many observers.

Tropicana owner Bally’s Corp. filed for a commercial demolition permit with Clark County as preparations continue to build a ballpark for the Oakland Athletics.

The March gaming win was strong — but not as strong as a year ago when casinos had all-time-record slot machine revenue due to a stellar lineup of special events.

Neal Schon of Journey says the Sphere was made for jam bands, but his band would crush it, too.